Smart Taxi
- Client: NYC Taxi Trip Information Predict Web
- Date: Feburary 2016
- Service: Web Design and Development
- Tools: HTML, CSS, Javascript, Polymer, Mapbox

A Data Science Visualization Project
We designed this NYC Taxi Trip Information Predict Web for a data science project of my colleague. I took part in developing the site navigation method and graphics, layouts, interactive components and visual style. Front-end pages are mainly coded in Polymer, Html and CSS and the data is visualized in Javascript library - MapBox.js.
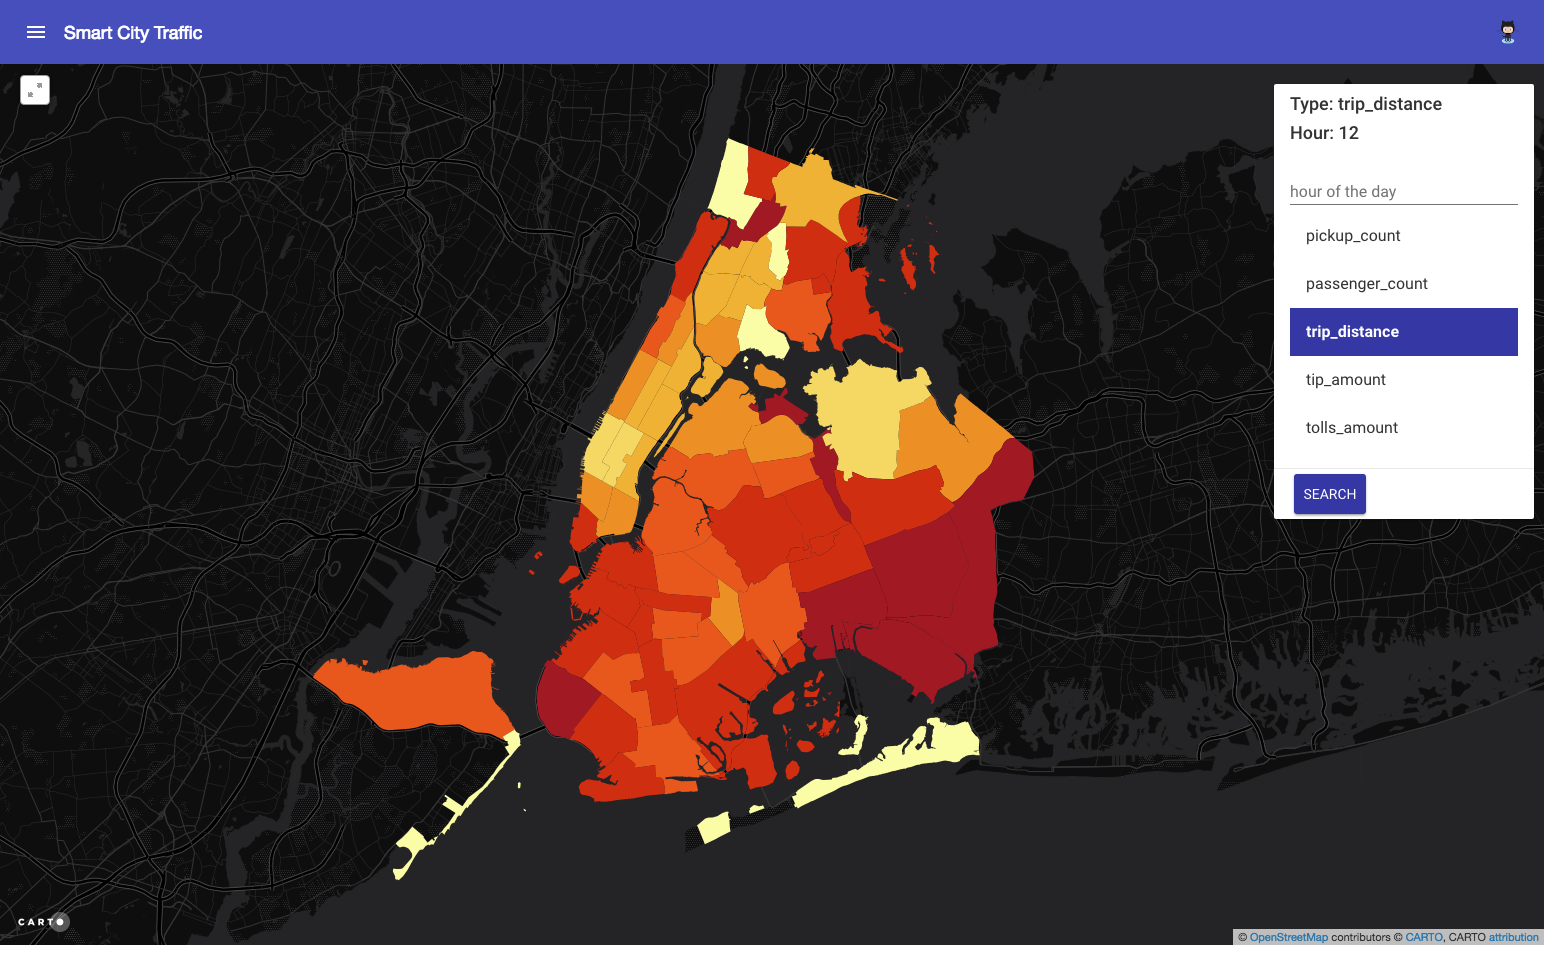
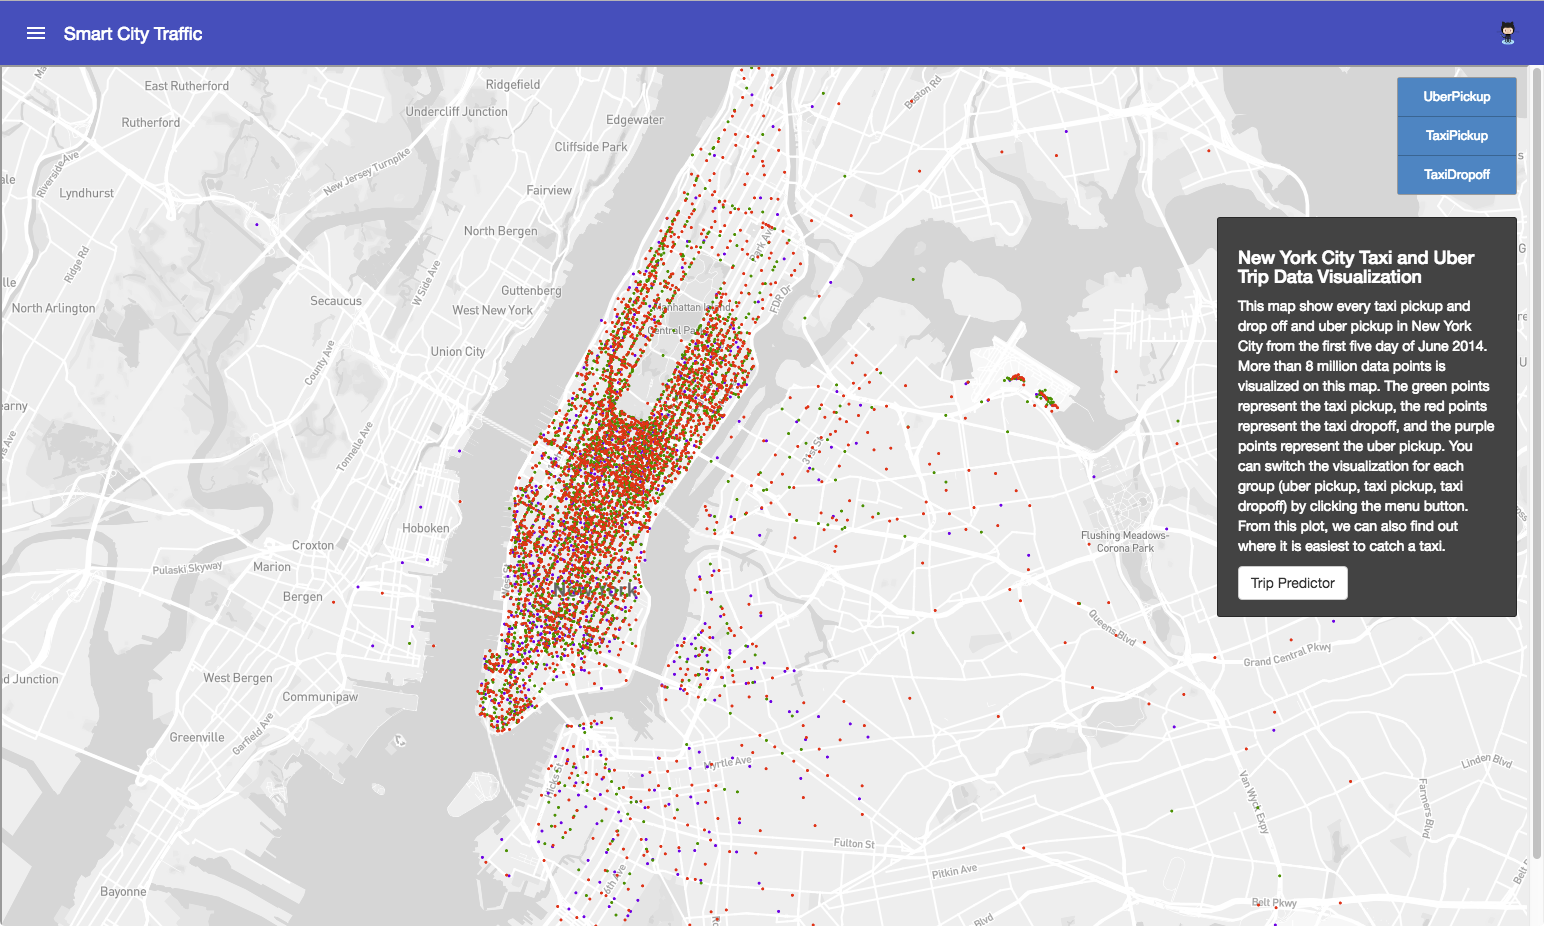
This web application analyzes one billion taxi trip data in New York City and takes the advantage of machine learning technology to predict trip information based on user input such as date, time of day, pick-up and drop-off locations. There are other useful statistics that can be referred to.


The Design
The design of interface is focused on simplicity and intuitiveness. It needs to be self-explained and fast responsive. Another requirement is to provide as much as visual data on the screen as possible. Therefore we used drop-down menu even its a large screen web application. We tried not to distract users from other information. But they can also easily switch to any part of the functions easily by as less as only one or two clicks. We minimized the number of text information on the screen and tried hard to use as many as visual information to present data. We knew people using this web mostly want to have a broad view of the time and get the relative information. Thus this information is visualized in almost all pages to save the time of users. There are more functions in this web application that can be explored.

 CLOSE
CLOSE